Vault
VAULT
ZinTree

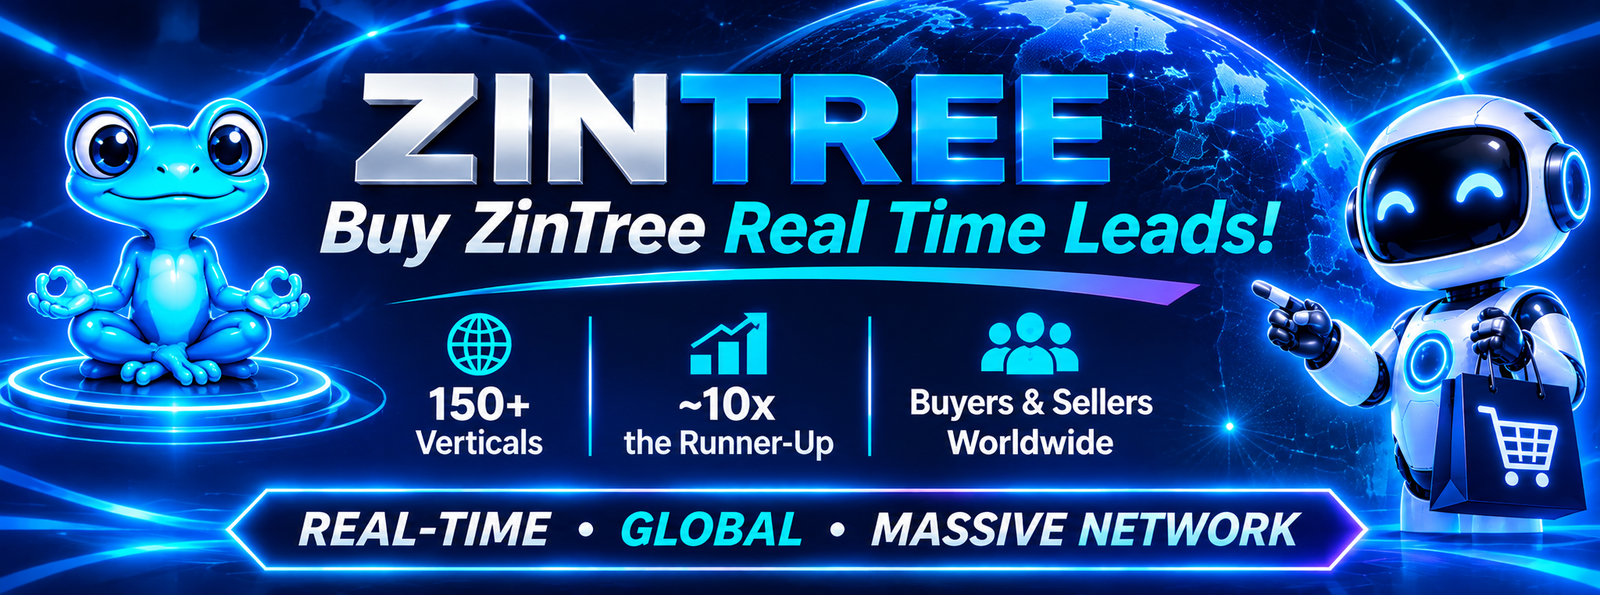
The ping tree for live transfers, posted leads and media leads · 150+ verticals
BUY ON THE ZINTREERegister as a buyer – bid in real timeSELL ON THE ZINTREECreate a listing, then register as a seller
"Trust The Shield" – Data Monster Protected Transactions
Live Transfers
 AI SHOPPERTell your AI Liaison what you want to buy"Trust The Shield"
 BUY LIVE TRANSFERSFill out the form – a CLO matches you fast"Trust The Shield"
 BUY PINGTREE LIVE TRANSFERSJoin the Ping Tree – your VIP AI answers any and all questions
LIVE TRANSFER TYPES
SMS
LIMITED ONBOARDINGSpots are filling – get in before it closesBUY SMS TEXTINGFully compliant bulk SMS texting"Trust The Shield"
BUY SMS TEXTINGFully compliant bulk SMS texting"Trust The Shield"WHAT YOU GET
Sales Leads
AI SHOPPERTell your AI Liaison what you want to buy"Trust The Shield"NEED LEADS FAST?Post to the vault – a CLO helps you get matched fast"Trust The Shield"SALES LEADS & DATA
DIALER & SPECIALTY
Hire & Jobs
AI SHOPPERHiring? Tell your AI Liaison. Remote agent? Get new job alerts"Trust The Shield"POST A JOB – FREEHire remote talentHIRE A CALL CENTEROur CLOs match you with the best call center for 440+ verticals"Trust The Shield"HIRE
Hire Remote TalentTech, Digital & EducationInbound Call Centers & Virtual StaffingOutbound Telemarketing & Lead Programs
JOBS & TALENT
Become a Seller
SELLER AIYou get your own Seller AI: market pricing, listing SEO and much more"Get The Shield"START SELLINGPick what kind of seller you are"Get The Shield"SELL ON ZINTREELive transfers & posted leads – your VIP AI answers any and all questions"Get The Shield"GET LINKEDSwap links with us and boost your SEO"Trust The Shield"PICK YOUR SELLER TYPE
HumanAPI

POST AI JOBS FREEHire humans AI can't replace – no interview fee
FOR HUMANSAI is hiring humans – get picked
FOR AI MANAGERS
FOR HUMANS
AI SERVICES
LEARN
Company
CONTACT USQuestions before you sign up?BECOME A CHIEF LIAISON OFFICERApply today – earn the shield"Trust The Shield"GET LINKEDSwap links with us and boost your SEO"Trust The Shield"
BECOME A CHIEF LIAISON OFFICERApply today – earn the shield"Trust The Shield"GET LINKEDSwap links with us and boost your SEO"Trust The Shield"COMPANY
About Data MonsterContact UsBlog / Industry NewsIndustriesDirectoryHow Protected Works1.888.420.DATA
PROGRAMS
MARKETPLACE
FROM THE BLOG
ZinTree
The ping tree for live transfers, posted leads and media leads · 150+ verticals
BUY ON THE ZINTREERegister as a buyer – bid in real timeSELL ON THE ZINTREECreate a listing, then register as a seller
"Trust The Shield" – Data Monster Protected Transactions
Live Transfers
AI SHOPPERTell your AI Liaison what you want to buy"Trust The Shield"BUY LIVE TRANSFERSFill out the form – a CLO matches you fast"Trust The Shield"BUY PINGTREE LIVE TRANSFERSJoin the Ping Tree – your VIP AI answers any and all questionsLIVE TRANSFER TYPES
Hire & Jobs
AI SHOPPERHiring? Tell your AI Liaison. Remote agent? Get new job alerts"Trust The Shield"POST A JOB – FREEHire remote talentHIRE A CALL CENTEROur CLOs match you with the best call center for 440+ verticals"Trust The Shield"HIRE
Hire Remote TalentTech, Digital & EducationInbound Call Centers & Virtual StaffingOutbound Telemarketing & Lead Programs
JOBS & TALENT
Become a Seller
SELLER AIYou get your own Seller AI: market pricing, listing SEO and much more"Get The Shield"START SELLINGPick what kind of seller you are"Get The Shield"SELL ON ZINTREELive transfers & posted leads – your VIP AI answers any and all questions"Get The Shield"GET LINKEDSwap links with us and boost your SEO"Trust The Shield"PICK YOUR SELLER TYPE
HumanAPI
POST AI JOBS FREEHire humans AI can't replace – no interview fee
FOR HUMANSAI is hiring humans – get picked
FOR AI MANAGERS
FOR HUMANS
AI SERVICES
LEARN
Company
CONTACT USQuestions before you sign up?BECOME A CHIEF LIAISON OFFICERApply today – earn the shield"Trust The Shield"GET LINKEDSwap links with us and boost your SEO"Trust The Shield"
BECOME A CHIEF LIAISON OFFICERApply today – earn the shield"Trust The Shield"GET LINKEDSwap links with us and boost your SEO"Trust The Shield"COMPANY
About Data MonsterContact UsBlog / Industry NewsIndustriesDirectoryHow Protected Works1.888.420.DATA
PROGRAMS
MARKETPLACE
FROM THE BLOG